
Informação certa, no momento certo: transforme dados em estratégia!
Inovação que conecta, soluções que transformam.
Análise de Dados
Transformamos dados em insights para decisões rápidas.
Soluções personalizadas em business intelligence para você.
Desenvolvimento em Laravel para sistemas eficientes.
Business Intelligence
Soluções Personalizadas
Especialistas em Dados e BI
Transformamos informações em decisões estratégicas, utilizando ferramentas de business intelligence e desenvolvimento em Laravel para soluções personalizadas e eficientes para sua empresa.
150+
15
Confiança e Resultados
Análise Profunda
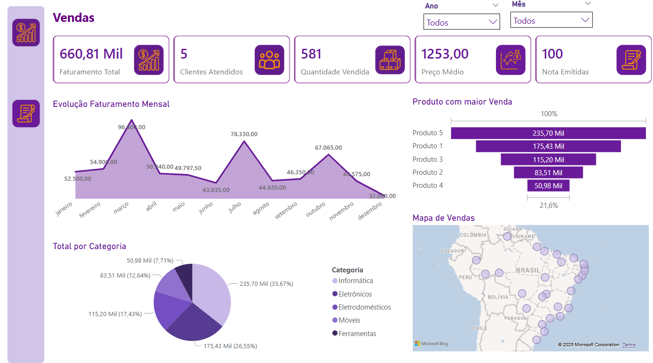
Análise de Dados
Desenvolvemos indicadores personalizados para facilitar a tomada de decisões estratégicas na sua empresa.


Business Intelligence
Utilizamos ferramentas de BI para transformar dados em insights valiosos e impulsionar seu negócio.
Soluções Personalizadas
Criamos soluções em Laravel que atendem às necessidades específicas da sua empresa, otimizando processos.
Indicadores Personalizados
Transforme dados em decisões estratégicas com nossas soluções eficientes.


A Dby Tech transformou nossos dados em insights valiosos, facilitando decisões estratégicas e aumentando nossa eficiência.
João Silva

A equipe da Dby Tech nos ajudou a estruturar dados, melhorando significativamente nossa tomada de decisão diária.
Maria Costa
